1Overview
Cold traps usually rely on ice, dry ice or a compressor chiller. This project replaces them with a compact thermoelectric bath that has an adjustable set point and no moving refrigerant, built only from parts that are easy to find.
2The Build
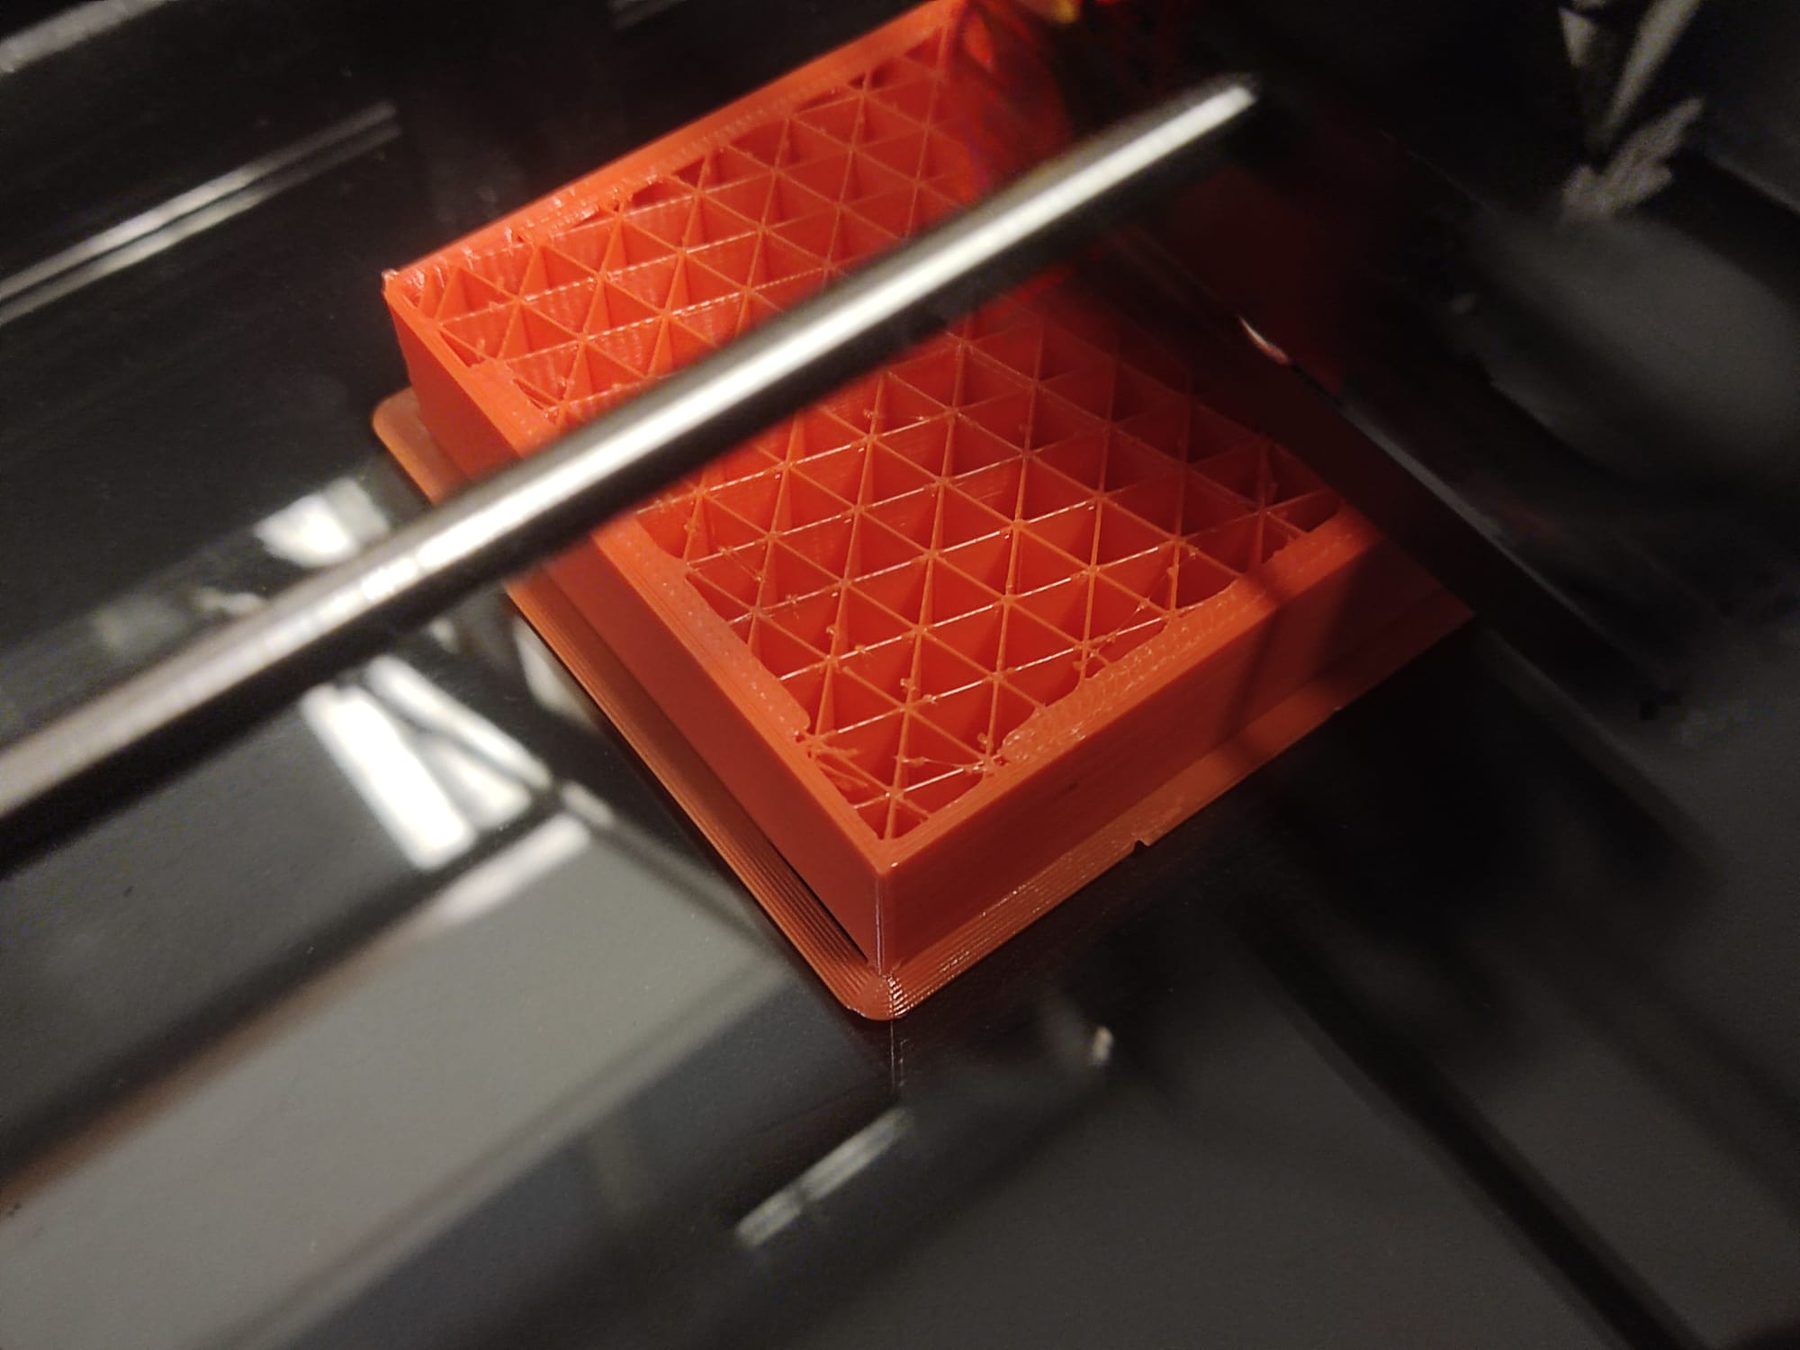
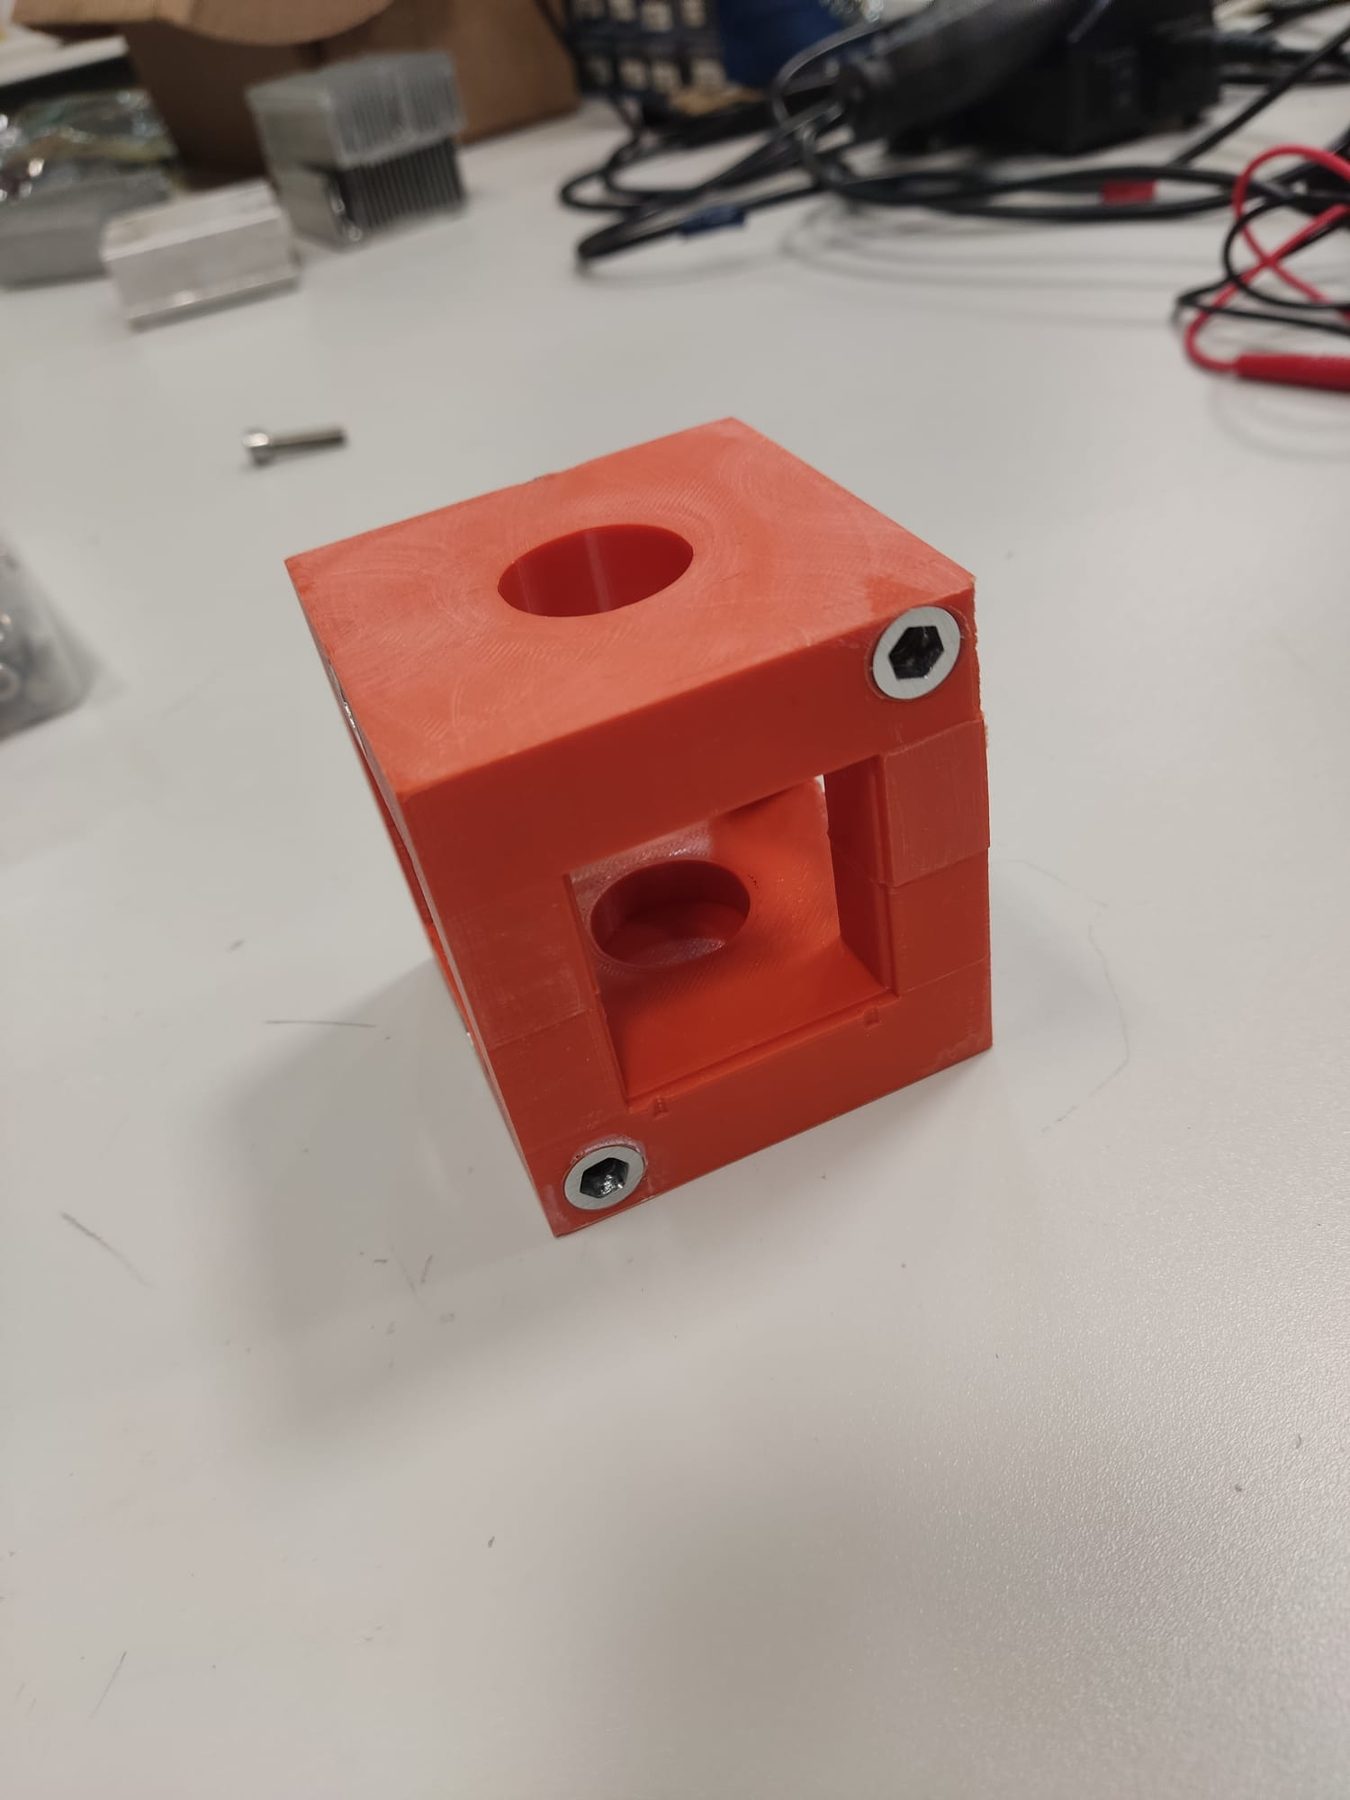
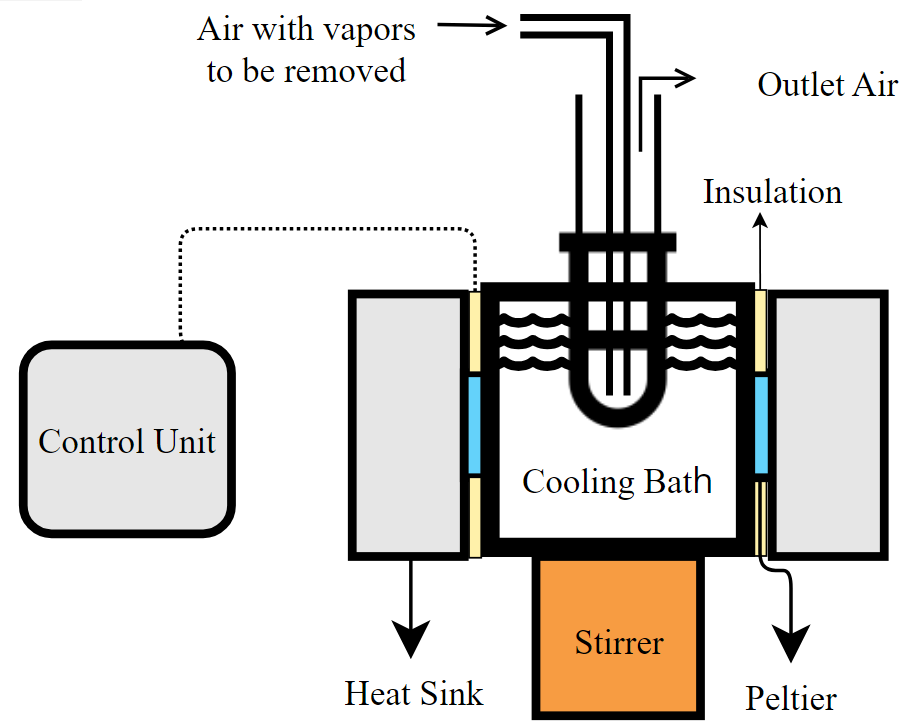
The body is a 3D-printed ABS cube with insulating air pockets in its walls and four windows that hold the 40 mm Peltier modules. The inside is sealed with epoxy.
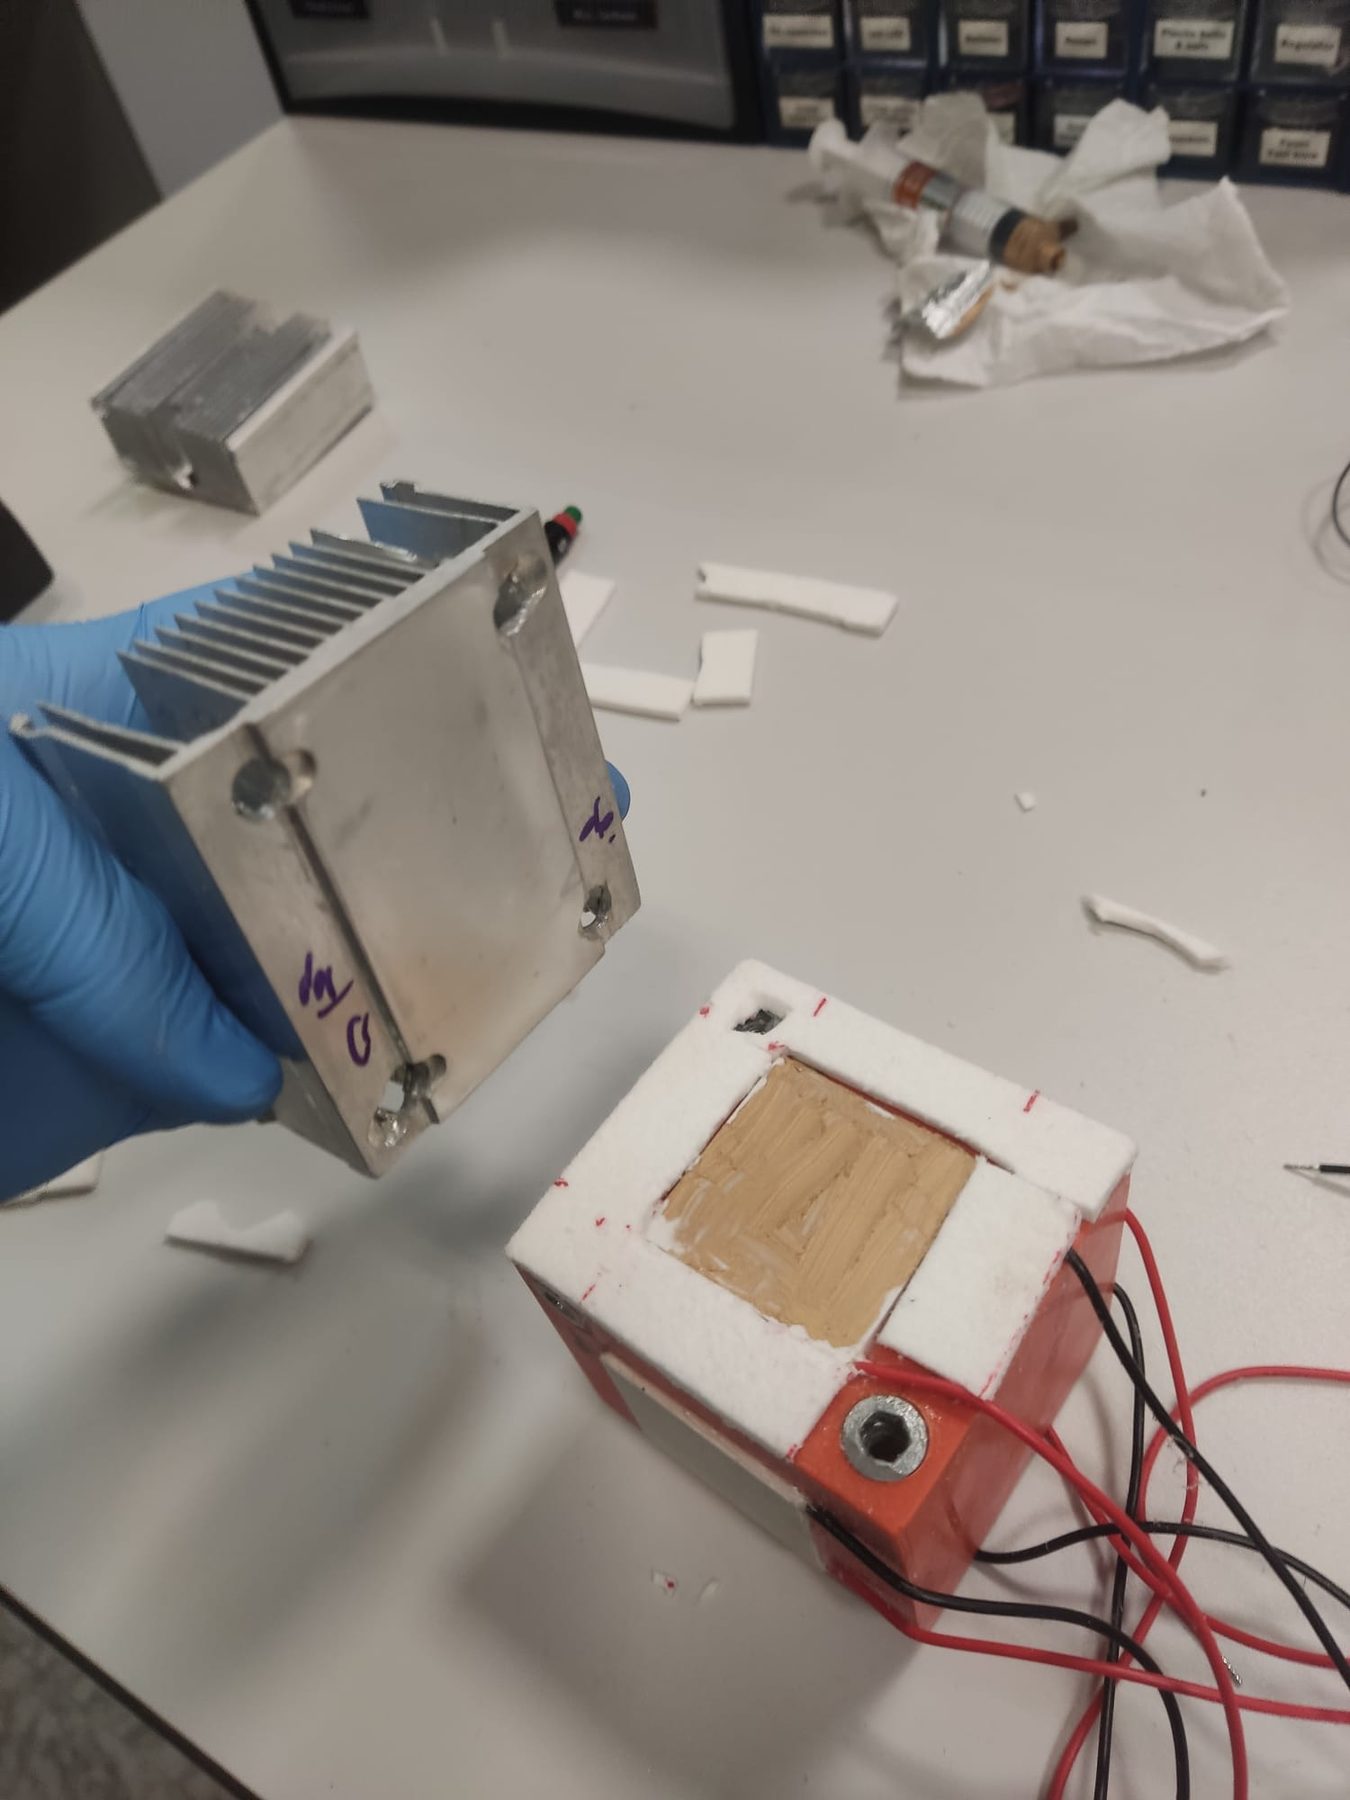
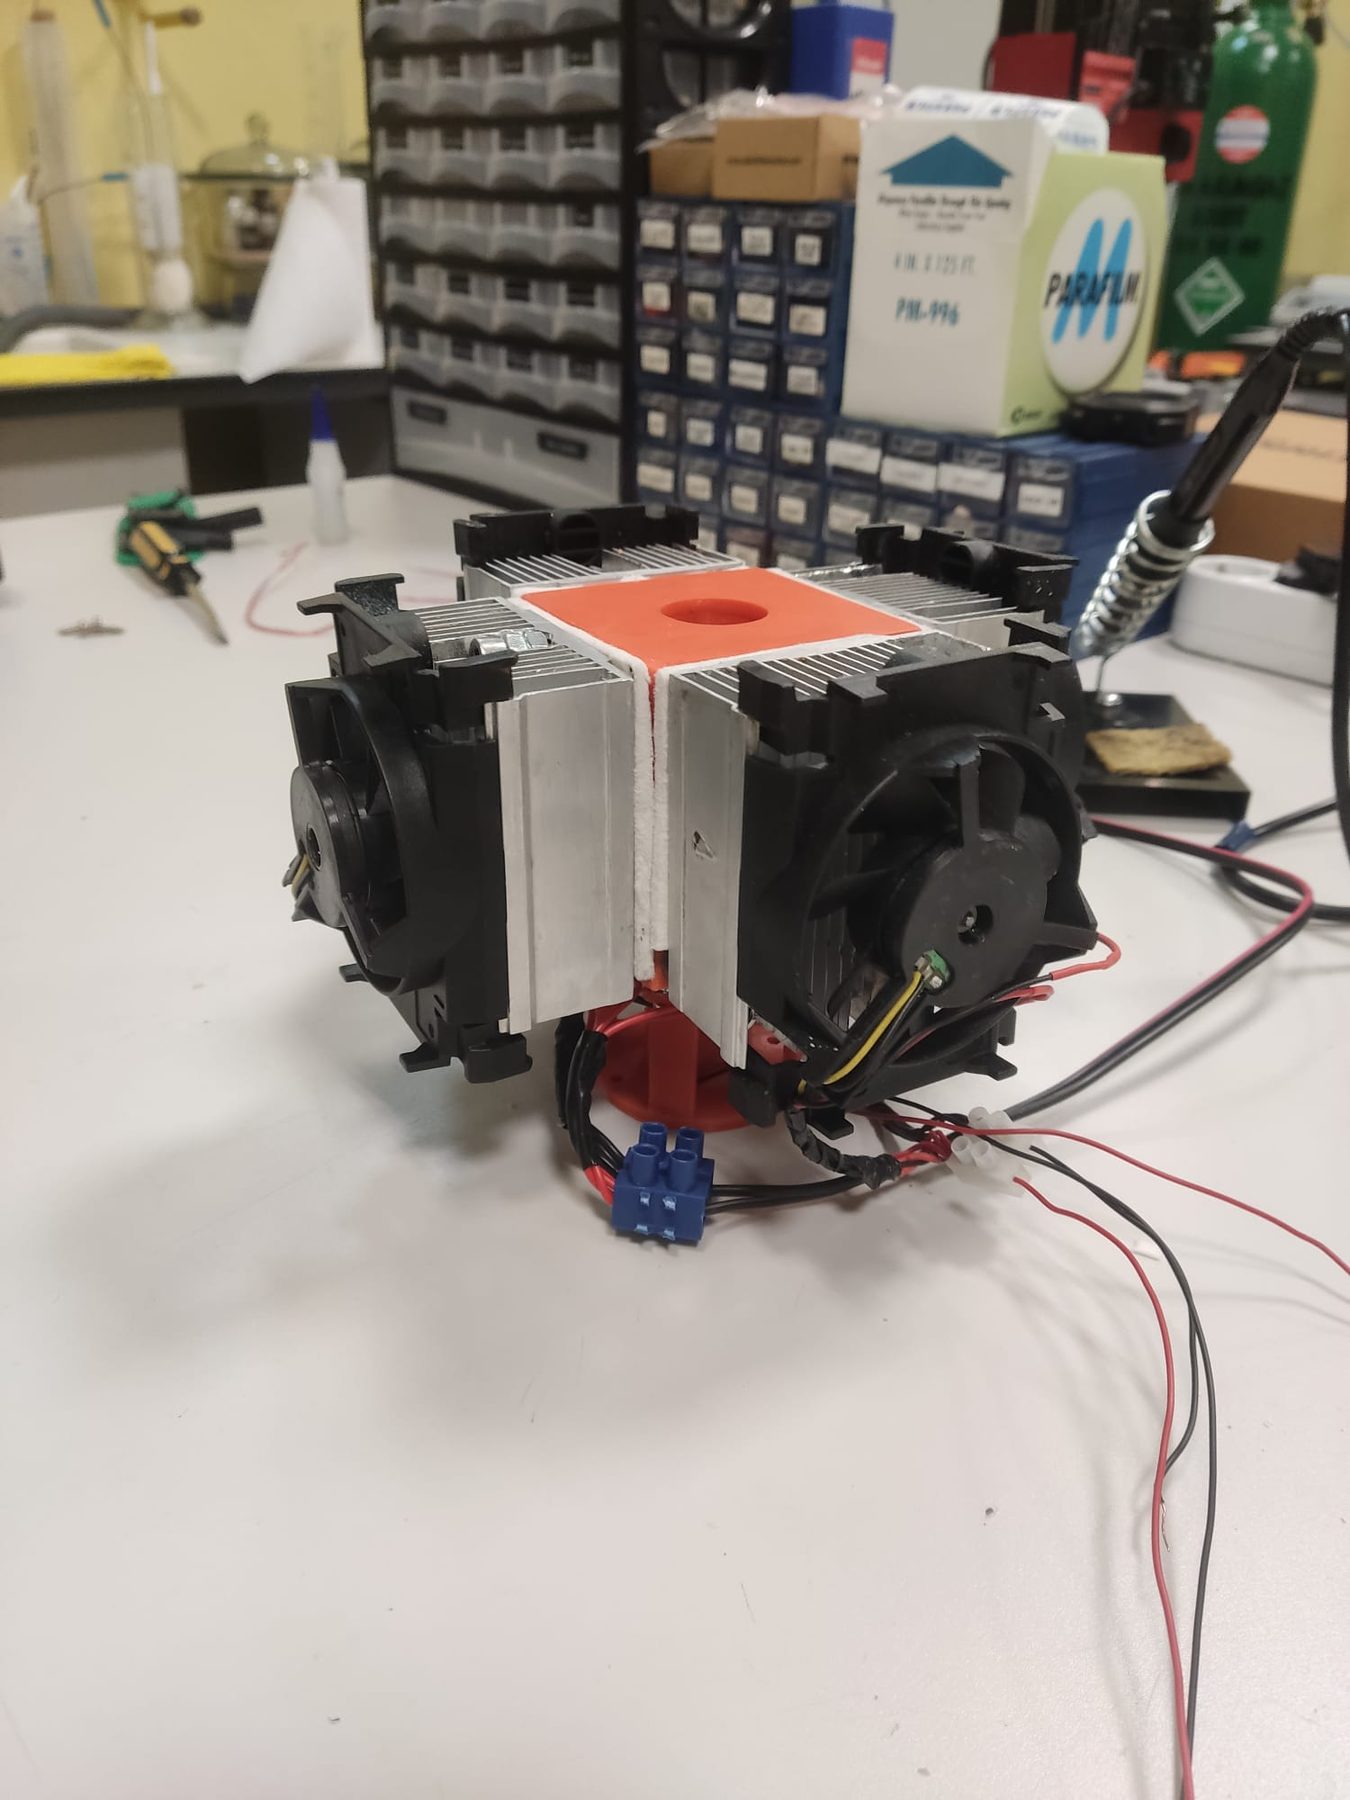
A Peltier module pumps heat from its cold face to its hot face when a current flows through it. Its net cooling power is the Peltier heat minus half of the Joule heat generated in the module and the heat conducted back from the hot side, so the hot side has to be cooled well for the cold side to get cold (Goldsmid, 2016, Eqs. 2.3–2.5; Rowe, 2006). Each module is bonded in with silicone and cooled by a heatsink and fan. A small magnetic stirrer under the cube keeps the liquid mixed.
3Control
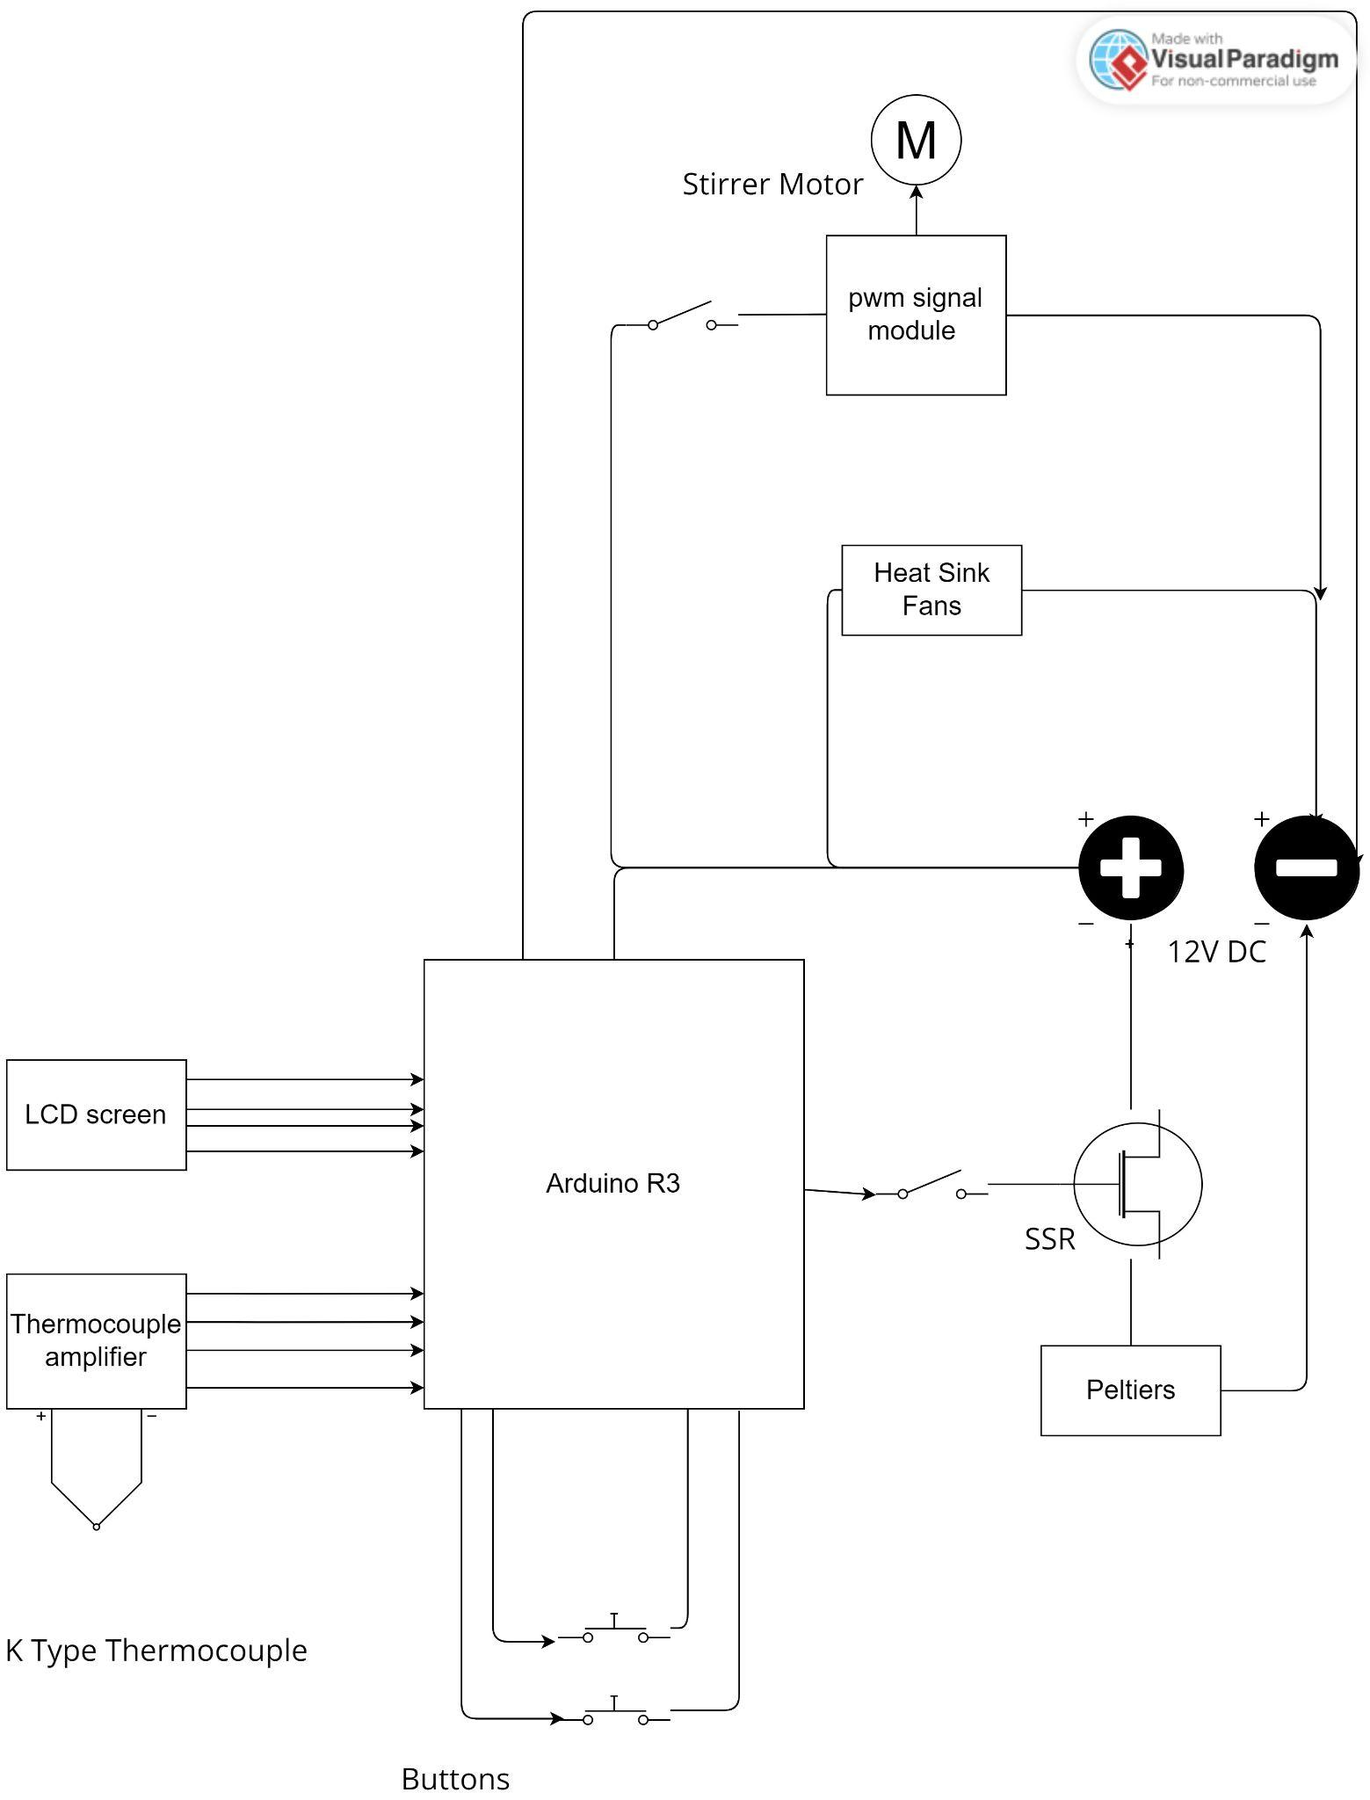
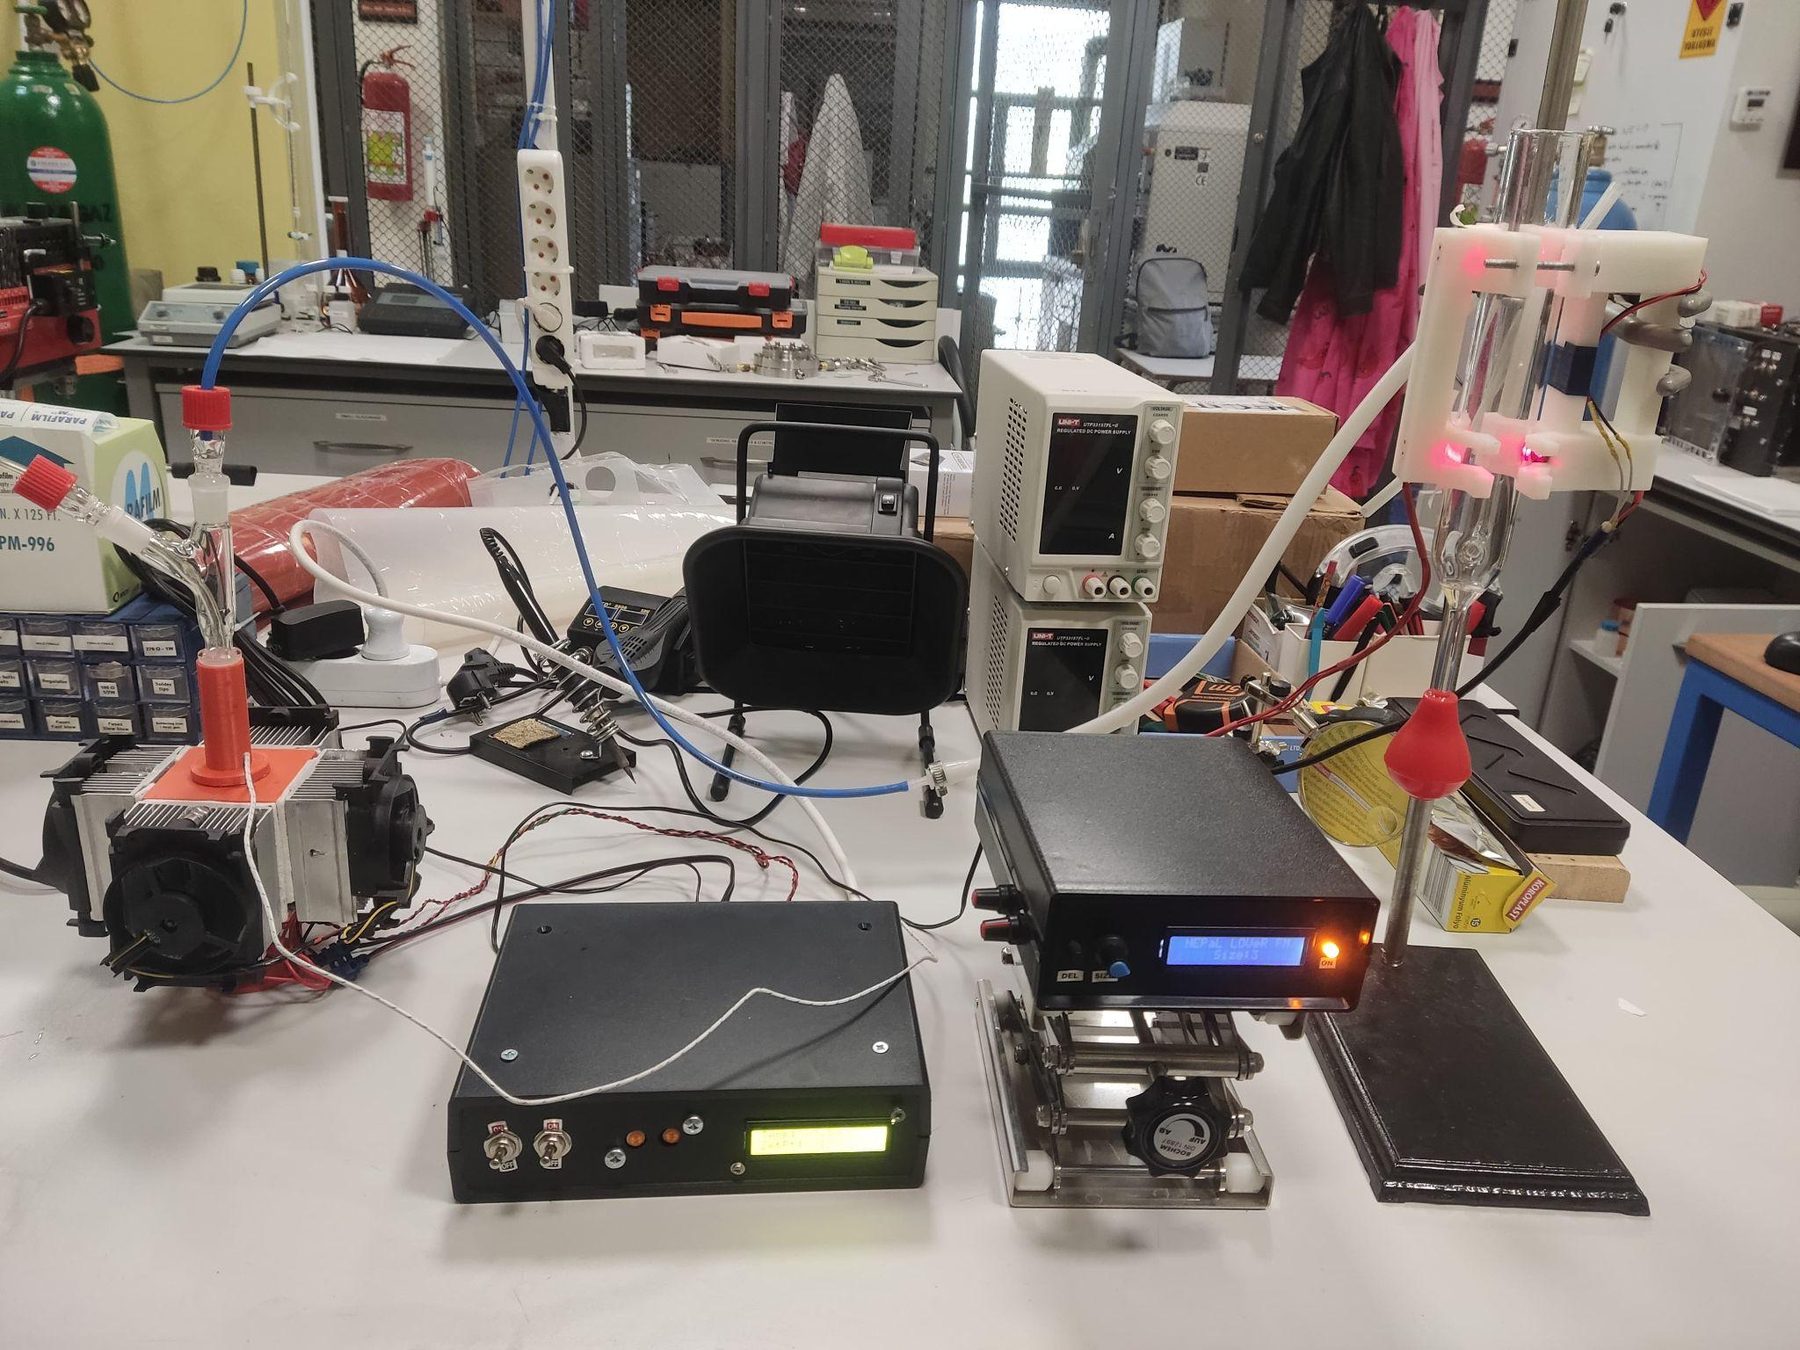
An Arduino reads a K-type thermocouple and switches the 12 V, 20 A Peltier supply through a solid-state relay, using on–off control with a small deadband. On–off control is the simplest feedback law; the deadband keeps the relay from chattering at the cost of a small, steady oscillation around the set point (Seborg et al., 2011, Sec. 8.4).
Show the bill of materials
| Qty | Item | Price (Türkiye) | USD (32 ₺ = $1) |
|---|---|---|---|
| 1 | 16×2 LCD screen with I²C module | ₺80 | $2.50 |
| 1 | Arduino Uno (clone) | ₺150 | $4.69 |
| 4 | TEC1-12705 Peltier module, 12 V 49 W, 40×40 mm | ₺400 | $12.50 |
| 4 | Peltier heatsink with fan | ₺700 | $21.88 |
| 2 | Push button | ₺20 | $0.63 |
| 1 | DC–DC solid-state relay, 5 V (40 mA) gate / 12 V (40 A) | ₺350 | $10.94 |
| 2 | Toggle switch ON–OFF | ₺20 | $0.63 |
| 1 | 230 V switch | ₺10 | $0.31 |
| 1 | DC power supply (min. 12 V, 41 A) | ₺800 | $25.00 |
| 1 | K-type thermocouple | ₺80 | $2.50 |
| 1 | MAX31855 thermocouple amplifier | ₺550 | $17.19 |
| 1 | Magnetic stir bar | ₺100 | $3.13 |
| 70 g | ABS filament | ₺32 | $1.00 |
| 1 | Cables, leads and pins | ₺50 | $1.56 |
| Total | ₺3,342 | $104.44 |
4Results
The lowest liquid temperature follows the room temperature almost linearly, reaching −9.9 °C at 17 °C.
Stirring cut the time to steady state from 27 to 20 minutes.
The bath reached a 0 °C set point in 11 minutes and held it within about ±0.5 °C.
5Moisture Trapping
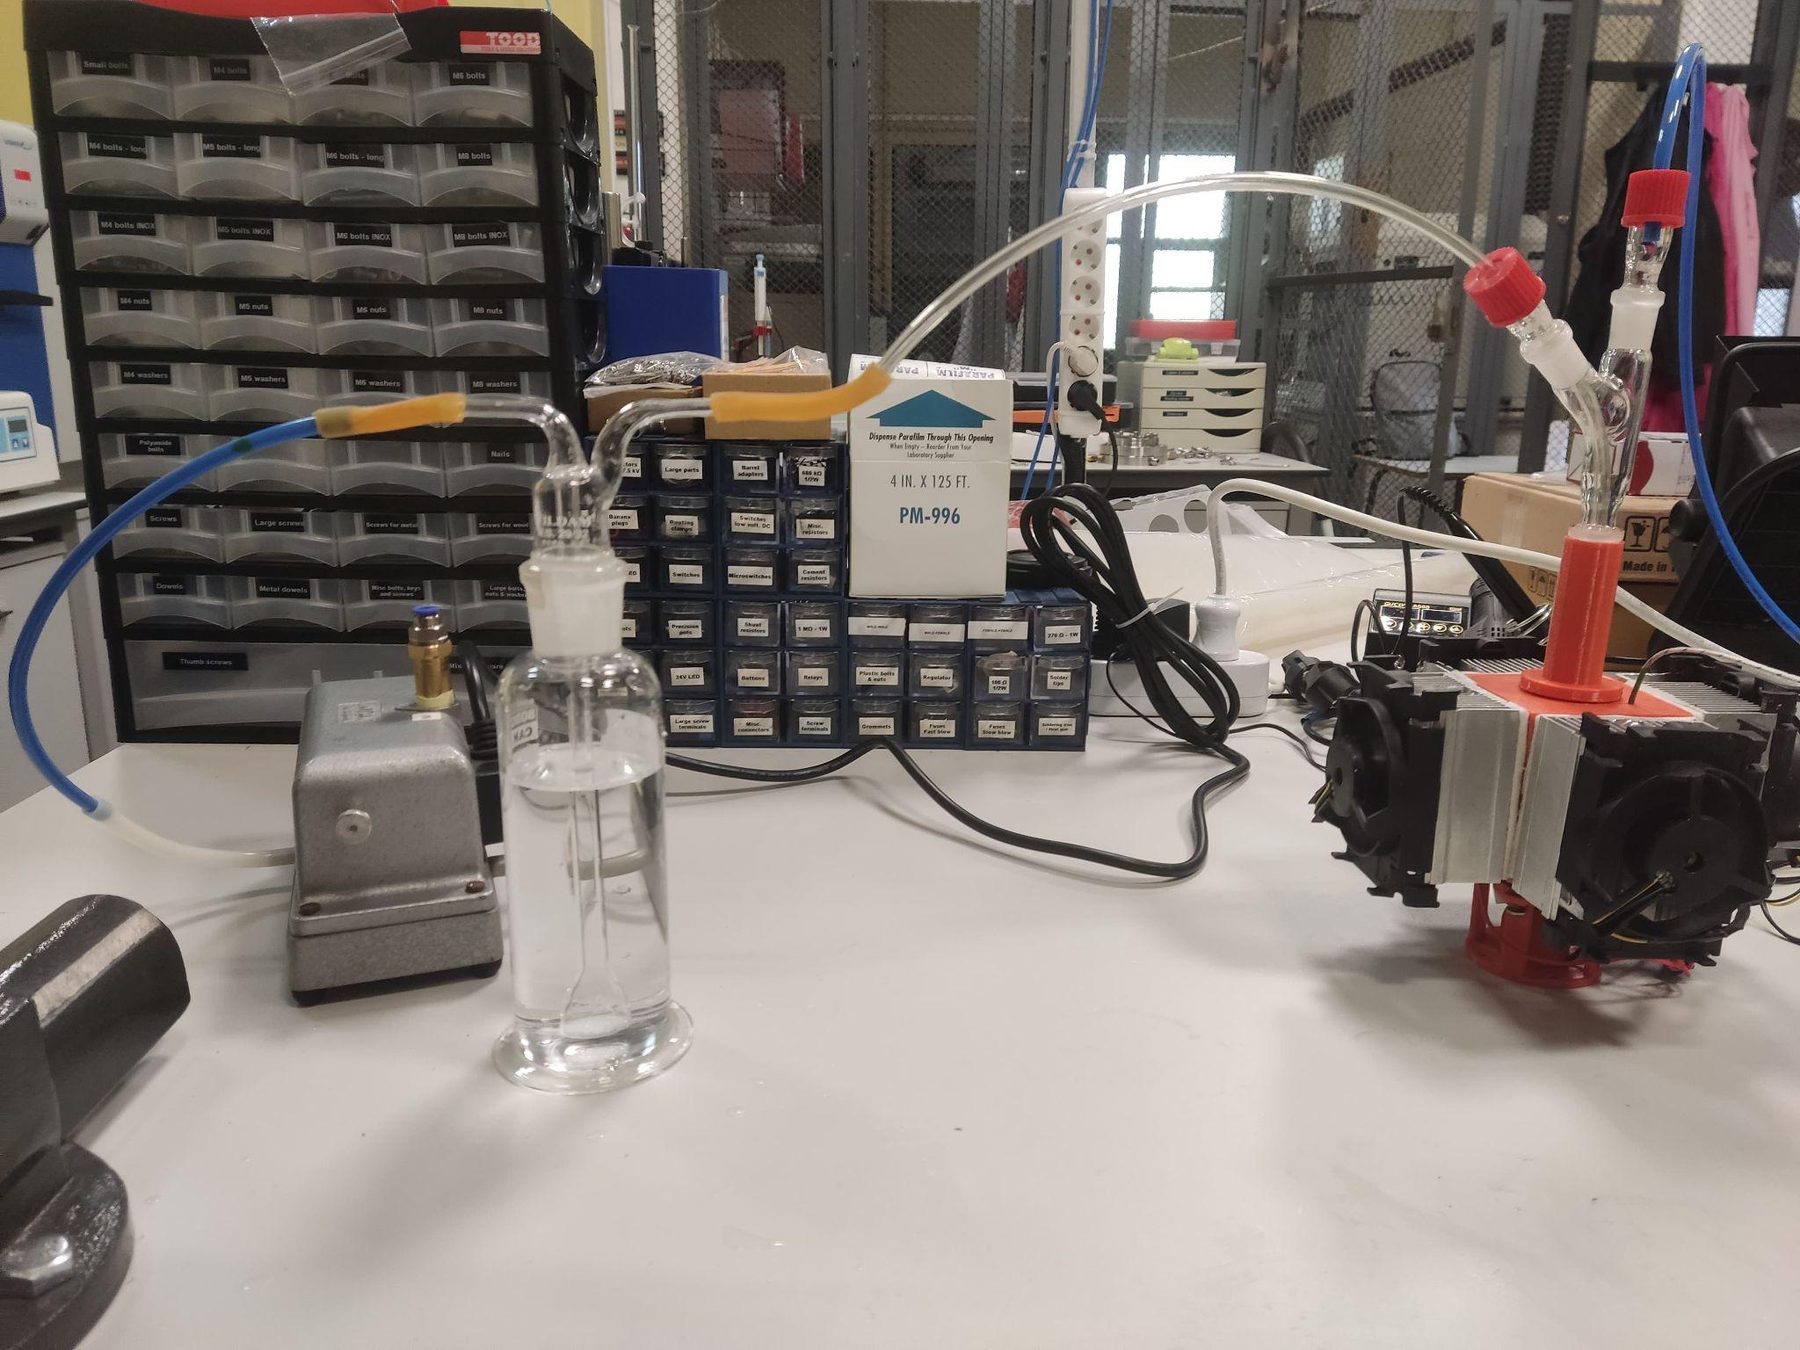
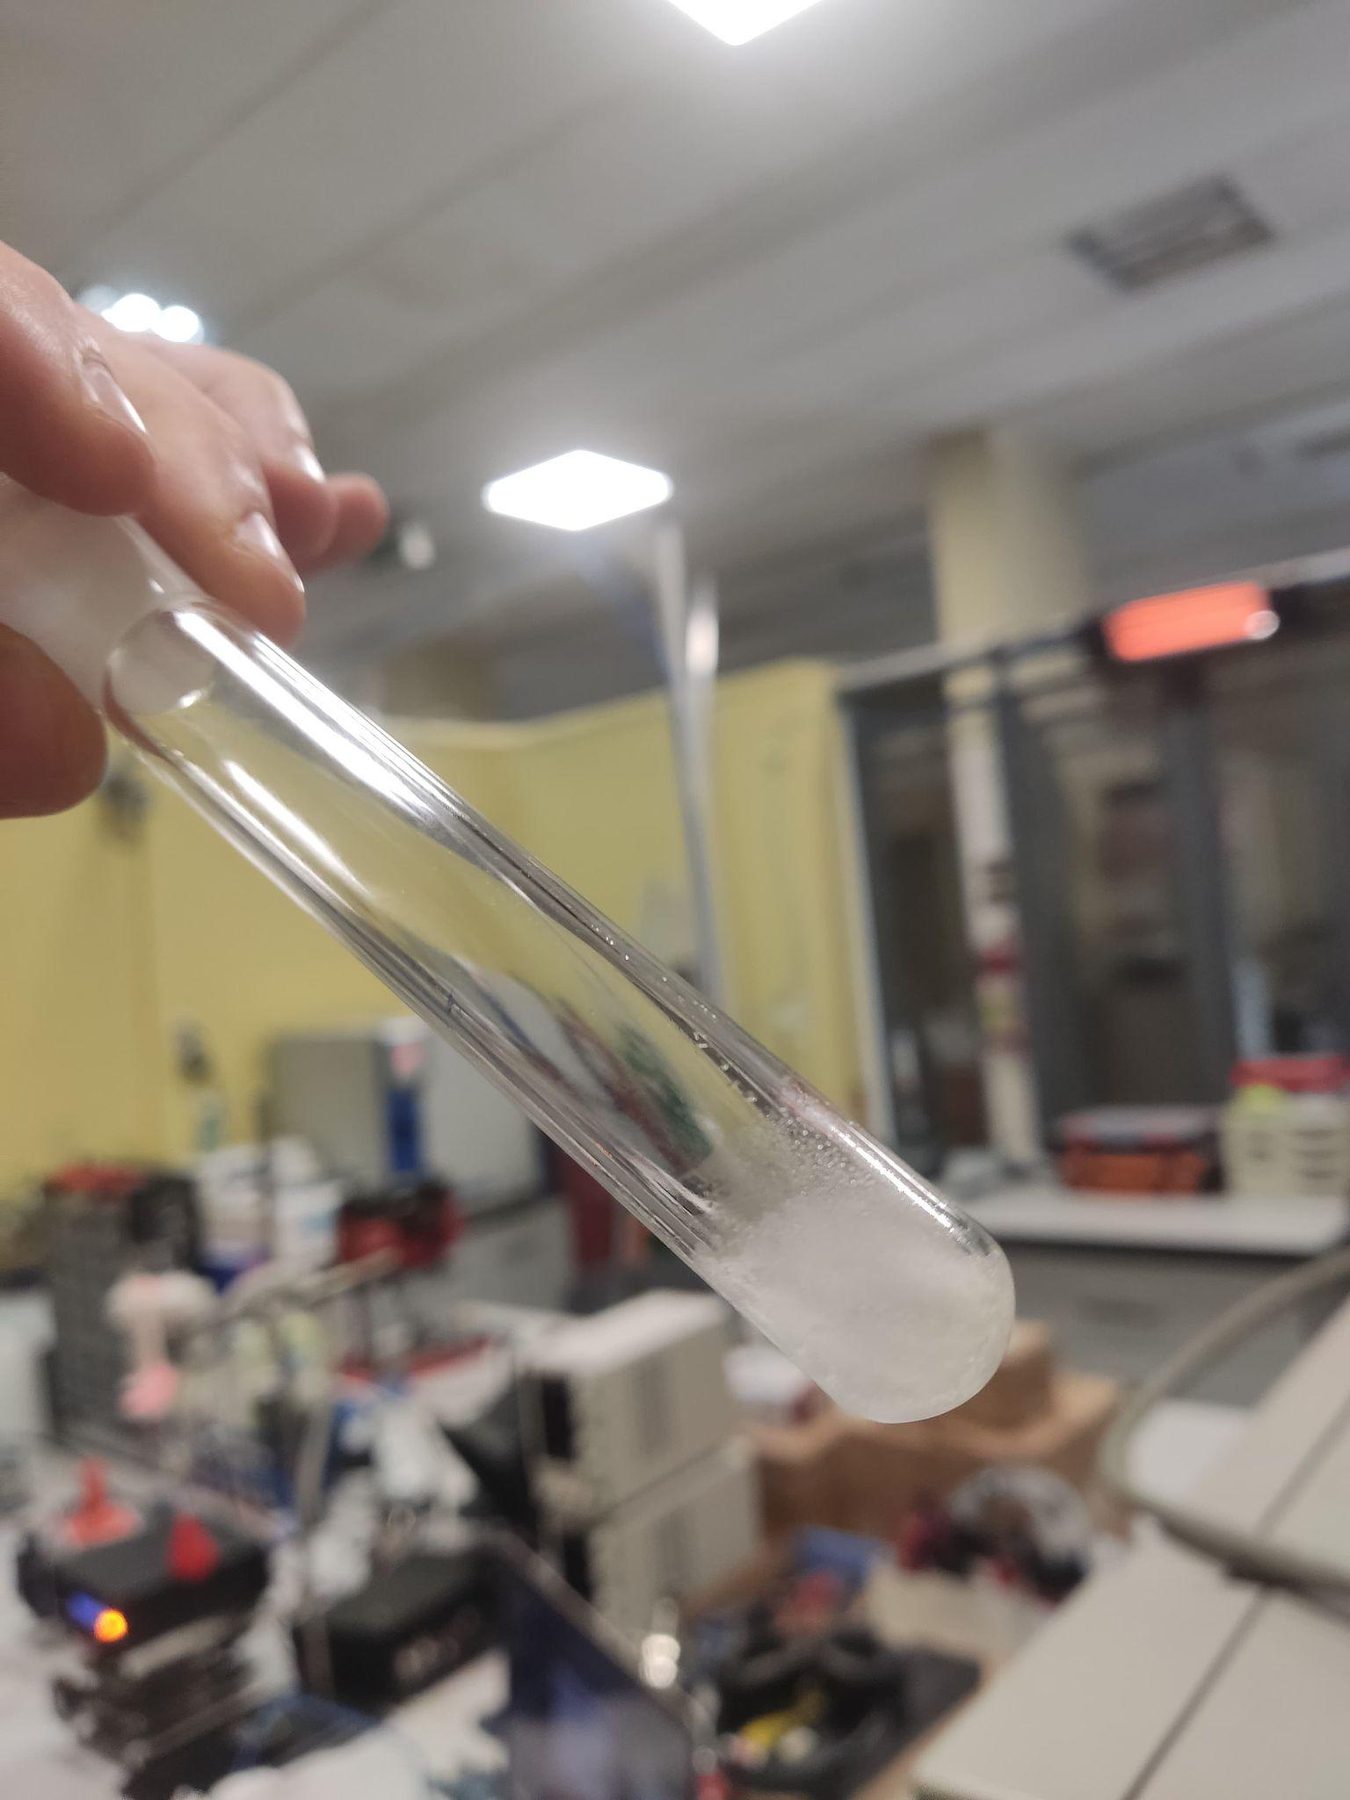
Humid air was passed through a glass tube immersed in the bath and the ice collected in the tube was weighed. At low flows the bath removed practically all of the moisture. The limit is set by the frost point: gas leaving a tube wall at −10 °C can carry at most the vapour pressure of ice at that temperature, about 2.6 hPa, which is roughly 11 % relative humidity once the gas is back at 20 °C (WMO, 2018; Sonntag, 1990). At higher flows the gas leaves before it has cooled to the wall temperature, so more water passes.
| Air flow (cm³/s) | Water removed (g/min) | Outlet humidity (%) |
|---|---|---|
| 5.3 | 0.006 | < 2 |
| 10.6 | 0.007 | < 2 |
| 61.8 | 0.027 | 45 |
| 200 | 0.042 | 74 |
6Modelling
The follow-up work models the Peltier together with its heatsink, so the cold-side temperature can be predicted from the room temperature and the heatsink's thermal resistance alone. The module is described by a constant-parameter model whose resistivity, thermal conductivity and geometry factor were fitted to measurements, which predicts real modules much better than the parameters derived from datasheet maxima (Lineykin & Ben-Yaakov, 2007; Goldsmid, 2016, Ch. 2). That model runs in the Peltier + heatsink calculator.
Show the Arduino code
#include <Adafruit_MAX31855.h>
#include <Wire.h>
#include <LiquidCrystal_I2C.h>

#define MAXDO   5
#define MAXCS   6
#define MAXCLK  7

Adafruit_MAX31855 thermocouple(MAXCLK, MAXCS, MAXDO);
const int RELAY = 10;
const int up_key = 13;
const int down_key = 12;
int SetPoint = 0;
int deadband = 0.5;
LiquidCrystal_I2C lcd(0x27, 16, 2);

const int numReadings = 5;     // moving-average window
double readings[numReadings];
int readIndex = 0;
double total = 0;
double averageTemperature = 0;

void setup() {
  pinMode(RELAY, OUTPUT);
  pinMode(up_key, INPUT_PULLUP);
  pinMode(down_key, INPUT_PULLUP);
  lcd.begin();
  lcd.backlight();
  lcd.setCursor(0,0); lcd.print("Bhdr WORKS");
  lcd.setCursor(0,1); lcd.print("TEC COOLER");
  digitalWrite(RELAY, HIGH);
  delay(4000);
  Serial.begin(9600);
  for (int i = 0; i < numReadings; i++) readings[i] = 0;
}

void loop() {
  // moving average of the thermocouple reading
  total -= readings[readIndex];
  readings[readIndex] = thermocouple.readCelsius();
  total += readings[readIndex];
  readIndex = (readIndex + 1) % numReadings;
  averageTemperature = total / numReadings;

  unsigned long seconds = millis() / 1000;
  Serial.print("Average Temperature: ");
  Serial.print(averageTemperature);
  Serial.print(" C | Time: ");
  Serial.print(seconds);
  Serial.println(" seconds");

  lcd.clear();
  lcd.setCursor(0,0); lcd.print("Temp: ");  lcd.print(averageTemperature); lcd.print(" C");
  lcd.setCursor(0,1); lcd.print("SetPt: "); lcd.print(SetPoint);           lcd.print(" C");

  if (digitalRead(down_key) == LOW && SetPoint > -50)  SetPoint--;
  if (digitalRead(up_key)   == LOW && SetPoint < 150)  SetPoint++;

  // on–off control with deadband
  if (averageTemperature > SetPoint + deadband)      digitalWrite(RELAY, HIGH);
  else if (averageTemperature < SetPoint - deadband) digitalWrite(RELAY, LOW);

  delay(1000);
}
7References
- Goldsmid, H. J. (2016). Introduction to Thermoelectricity (2nd ed.). Springer, Berlin.
- Lineykin, S., & Ben-Yaakov, S. (2007). Modeling and analysis of thermoelectric modules. IEEE Trans. Ind. Appl., 43(2), 505–512.
- Rowe, D. M. (Ed.) (2006). Thermoelectrics Handbook: Macro to Nano. CRC Press, Boca Raton, FL.
- Seborg, D. E., Edgar, T. F., Mellichamp, D. A., & Doyle, F. J. (2011). Process Dynamics and Control (3rd ed.). Wiley, Hoboken, NJ.
- Sonntag, D. (1990). Important new values of the physical constants of 1986, vapour pressure formulations based on the ITS-90, and psychrometer formulae. Z. Meteorol., 40(5), 340–344.
- WMO (2018). Guide to Instruments and Methods of Observation (WMO-No. 8), Vol. I: Measurement of Meteorological Variables, Annex 4.B. World Meteorological Organization, Geneva.